Gold Threatens Breakout of 2022 Downtrend
Gold Technical Price Outlook: XAU/USD Short-term Trade Levels
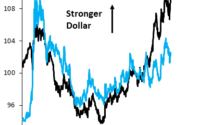
Gold prices surged more than 7% off the September / yearly lows with XAU/USD threatening a breakout of the 2021 yearly downtrend. The immediate focus is on a key resistance pivot just higher to validate a possible reversal pattern in the yellow metal. The battle lines are drawn heading into the close of the week. These are the updated targets and invalidation levels that matter on the XAU/USD short-term technical charts. Review my latest Strategy Webinar for an in-depth breakdown of this gold technical setup and more.
Starts in:
Live now:
Oct 10
( 12:10 GMT )

Weekly Strategy Webinars on Mondays at 12:30GMT
Weekly Scalping Webinar
Gold Price Chart – XAU/USD Daily
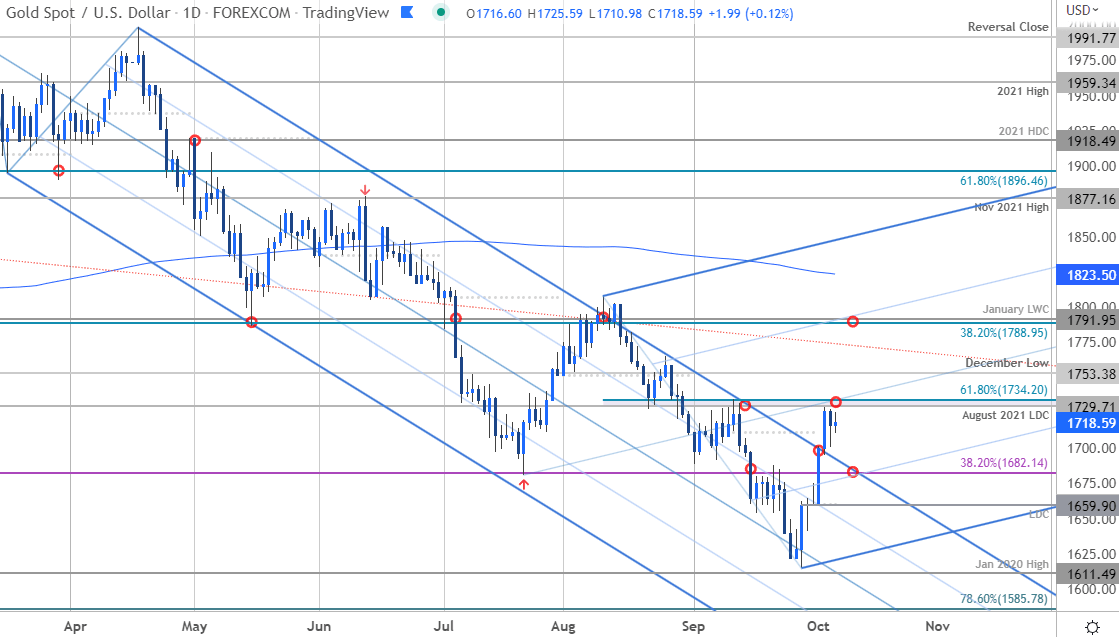
Chart Prepared by Michael Boutros, Technical Strategist; Gold on Tradingview
Technical Outlook: In last month’s Gold Short-term Price Outlook we noted that XAU/USD was, “rebounding off downtrend support into the close of the month and threatens a larger recovery / test of slope resistance in the days ahead.” The rally accelerated into the October open with price surging more than 3.4% since the start of the week. The advance has now broken through yearly downtrend resistance with a newly identified up-slope possibly in play here. The immediate focus is on key technical confluence at 1729/35– a region defined by the August 2021 low-day close, the 61.8% Fibonacci retracement of the August decline and the September swing high. A topside breach / weekly close above this threshold would be needed to validate a larger reversal / suggest a more significant low was registered last month.
Recommended by Michael Boutros
Download our latest quarterly Gold Price Forecast
Gold Price Chart – XAU/USD 240min
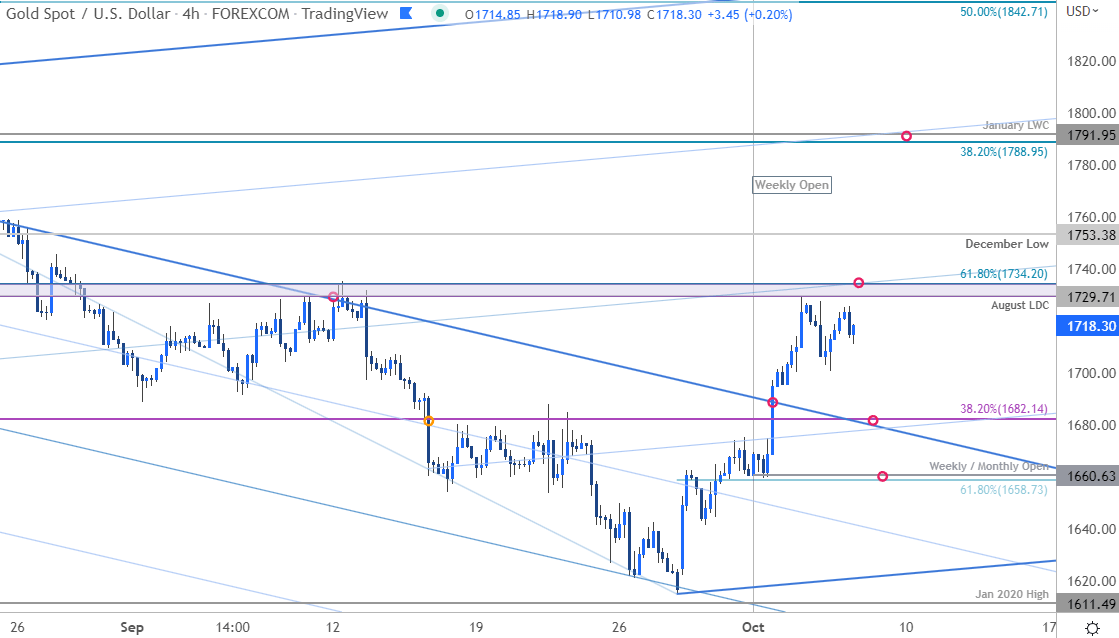
Notes: A closer look at Gold price action highlights the XAU/USD breakout with the advance ranging just below median-line resistance at 1729/35. Initial support now rests back at 1682 backed by the objective monthly open and the 61.8% retracement at 1658/60– we’ll reserve this threshold as our near-term bullish invalidation level. A topside breach / close above this pivot zone exposes subsequent topside objectives at the December low (1753) and the 38.2% retracement / January low-week close at 1788/92– look for a larger reaction there for guidance IF reached.
Bottom line: Gold is threatening a breakout of the yearly downtrend early in the month and is now approaching the first major test of resistance. From at trading standpoint, a good zone to reduce portions of long-exposure / raise protective stops- losses should be limited to 1658 IF price is indeed heading higher here with a breach of the median-line needed to fuel the next leg. Note that losses beyond the monthly range lows could fuel another accelerated decline and would put back into focus the broader double-top scenario presented last month. Stay nimble heading into the close of the week with US non-farm payrolls on Friday likely to spur some volatility here. Review my latest Gold Weekly Price Outlook for a closer look at the longer-term XAU/USD technical trading levels.
For a complete breakdown of Michael’s trading strategy, review his Foundations of Technical Analysis series on Building a Trading Strategy
Gold Trader Sentiment – XAU/USD Price Chart
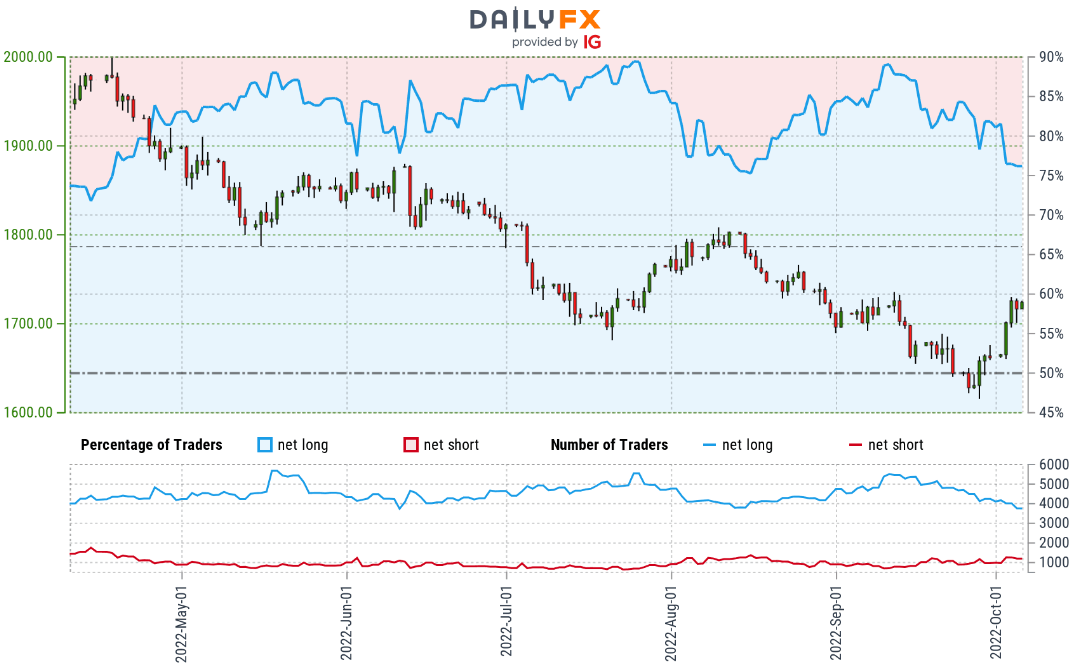
- A summary of IG Client Sentiment shows traders are net-long Gold- the ratio stands at +3.16 (75.94% of traders are long) – typically bearish reading
- Long positions are 1.04% higher than yesterday and 8.00% lower from last week
- Short positions are 7.70% lower than yesterday and 8.22% higher from last week
- We typically take a contrarian view to crowd sentiment, and the fact traders are net-long suggests Gold prices may continue to fall. Traders are more net-long than yesterday but less net-long from last week. The combination of current positioning and recent changes gives us a further mixed Gold trading bias from a sentiment standpoint.
| Change in | Longs | Shorts | OI |
| Daily | -1% | 8% | 1% |
| Weekly | -12% | 34% | -3% |
Economic Calendar
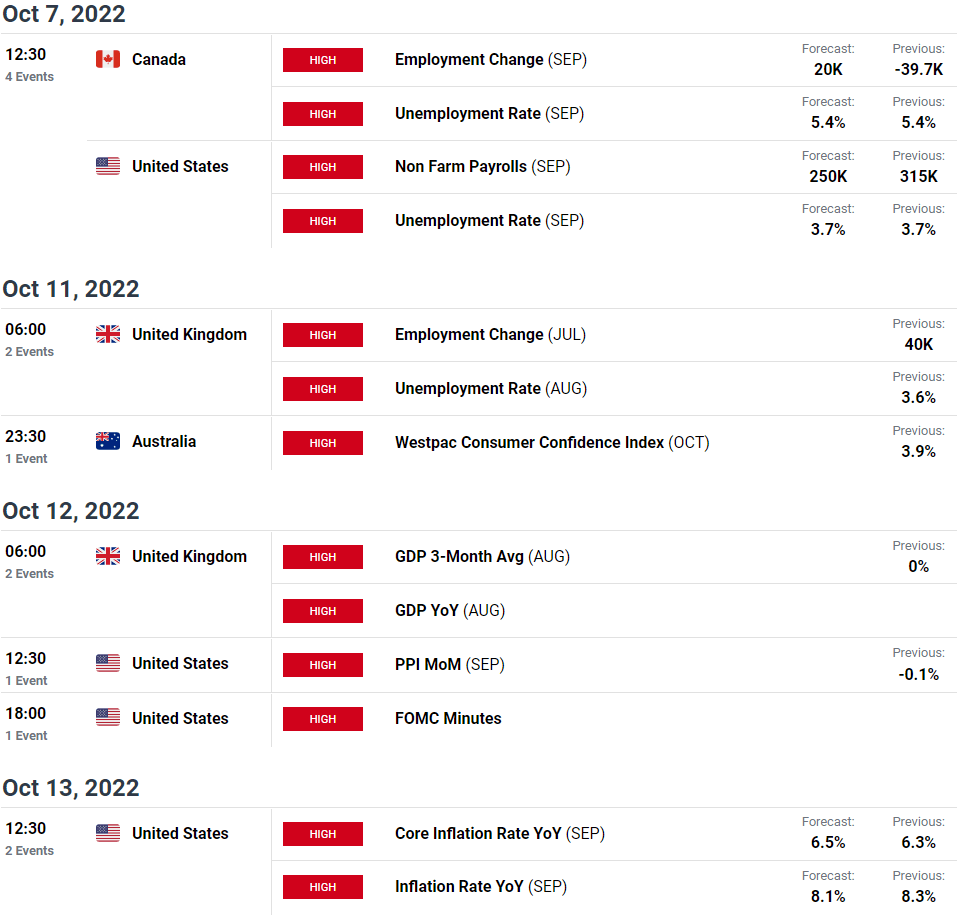
Economic Calendar – latest economic developments and upcoming event risk.
Active Technical Setups
– Written by Michael Boutros, Technical Strategist with DailyFX
Follow Michael on Twitter @MBForex
[ad_2]
Source link

The Fed’s stages of inflation grief, in Powell’s words
Notable Quotable | Today’s top gold news and opinion