Some Astonishing Trends in Retail Sales beyond the Month-to-Month Data Noise
Introducing my new retail sales charts of three-month moving averages to iron out the big month-to-month spikes and drops that clutter up the trends.
By Wolf Richter for WOLF STREET.
OK, I’ve had it with the artificial and useless drama of the month-to-month ups and downs of seasonally adjusted retail sales that are subject to big up-or-down revisions the following month. Retailers report their sales quarterly, and GDP is reported quarterly in the US, and so I’m going to switch my charts on retail sales to a three-month-moving average, which eliminates a lot of the noise that obscures the trends. And the past six months have been particularly noisy with huge ups and big downs.
Dropping prices impact retail sales. Also note that the CPI for many categories of products that these retailers sell has dropped, with gasoline prices plunging, food prices dipping, and many goods prices falling, as inflation has shifted to services, and retailers don’t sell services; they sell goods. Dropping prices mean dropping sales, even when the retailer sells the same amount of goods. Further below you will see a chart of sales by gas stations overlaid with a chart of the CPI for gasoline, and they obviously run in near-lockstep because consumers buy about the same amount of gasoline in gallons, but when the prices change so dramatically, revenues (in dollars) change with the prices.
So this is my classic chart. Total retail sales, seasonally adjusted, fell 1.0% in March from February, after a dip in February, a huge 3.1% spike in January, declines in December and November, and a jump in October.
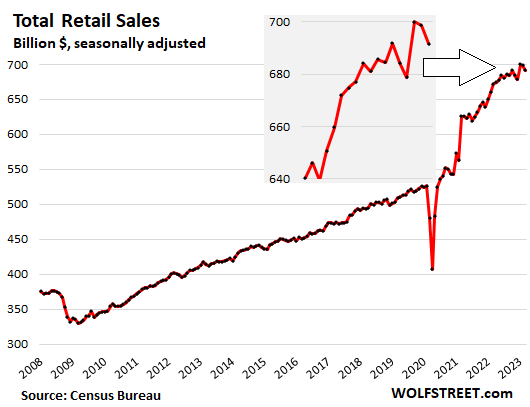
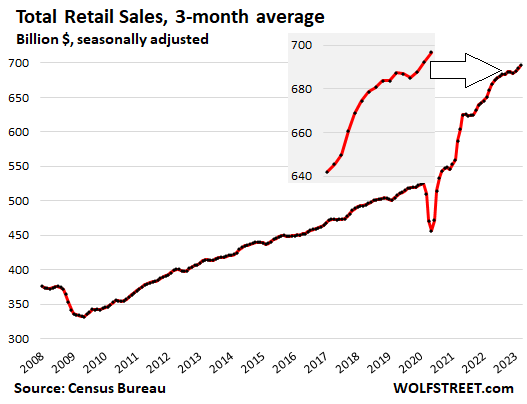
And this is my new chart of total retail sales as a three-month moving average. The March three-month moving average = the average of January, February and March, so representing Q1.
Q1 retail sales were up by 1.7% from Q4 and by 5.4% from the same period a year ago!
Reminder: Don’t apply overall CPI to retail sales because inflation has shifted to services, and retailers sell goods, and many goods prices have dropped or plunged, such as by 17% for gasoline! (My detailed discussion about inflation).
The insert shows the recent details of the trend: the slowdown late last year and a pickup so far this year:
Retail sales by category, 3-month moving average, seasonally adjusted.
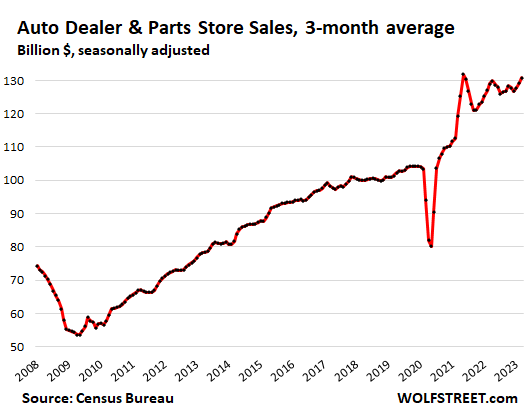
New and Used Vehicle and Parts Dealers (19% of total retail sales):
- Sales: $131 billion
- From prior month: +1.2%
- Year-over-year: +1.5%
- CPI used vehicles: -0.9% for the month, -11.2% year-over-year
- CPI new vehicles: +0.4% for the month, +6.1% year-over-year.
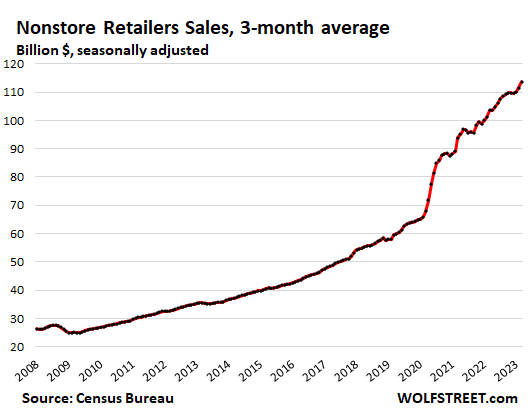
Ecommerce and other “nonstore retailers” (16% of total retail sales), ecommerce retailers, ecommerce operations of brick-and-mortar retailers, and stalls and markets:
- Sales: $114 billion
- From prior month: +2.0%
- Year-over-year: +9.8%
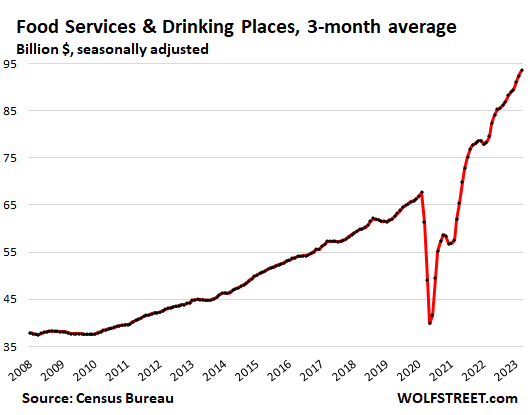
Food services and drinking places (13% of total retail), includes restaurants, cafeterias, bars, etc.
- Sales: $93 billion
- From prior month: +1.2%
- Year-over-year: +17.5%
- CPI for “food away from home”: +0.6% for the month, +8.8% year over year:
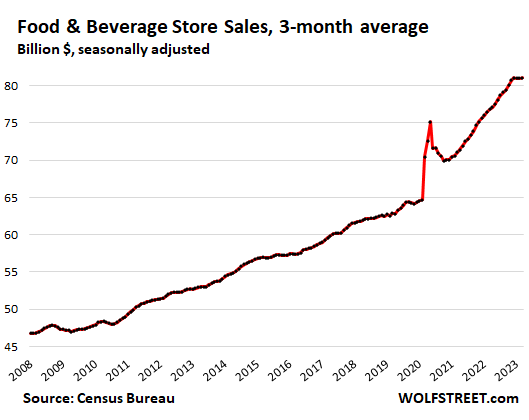
Food and Beverage Stores (12% of total retail):
- Sales: $81 billion
- From prior month: +0.1%
- Year-over-year: +5.5%
- CPI for “food at home”: -0.3% month-to-month, +8.4% year over year:
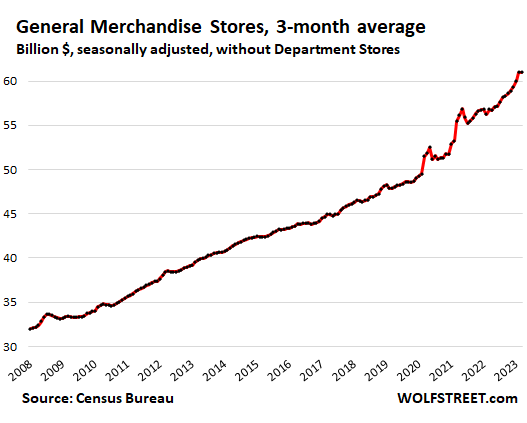
General merchandise stores, without department stores (9% of total retail):
- Sales: $61 billion
- From prior month: -0.1%
- Year-over-year: +7.4%
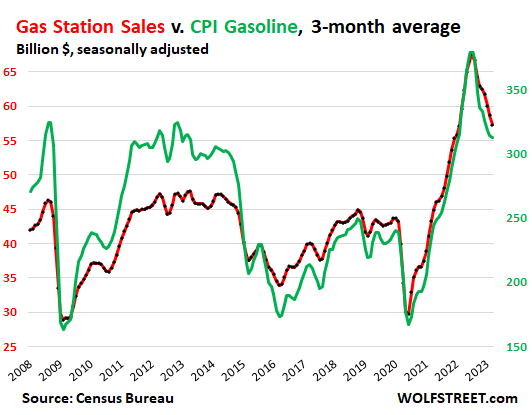
Gas stations (8% of total retail):
- Sales: $57 billion
- From prior month: -2.4%
- Year-over-year: -4.0%
- CPI for gasoline: -4.6% for the month, -17.4% year over year:
This chart shows the relationship between the CPI for gasoline (green, right axis) and sales in billions of dollars at gas stations, including the other merchandise gas stations sell (red, left axis):
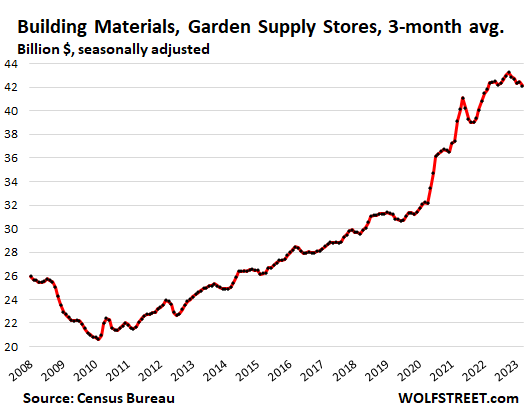
Building materials, garden supply and equipment stores (6% of total retail):
- Sales: $42 billion
- From prior month: -0.7%
- Year-over-year: -0.6%
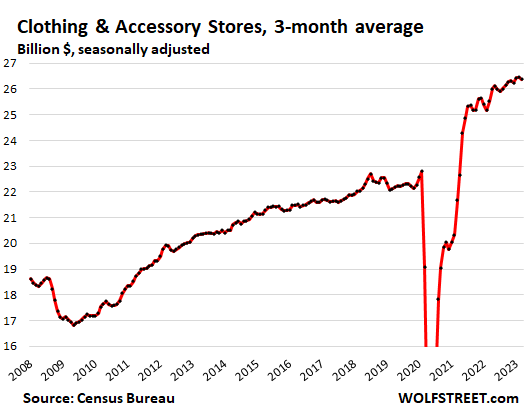
Clothing and accessory stores (4% of total retail):
- Sales: $26 billion
- From prior month: -0.3%
- Year-over-year: +3.3%
- CPI apparel: +0.3% for the month, +3.3% year-over-year.
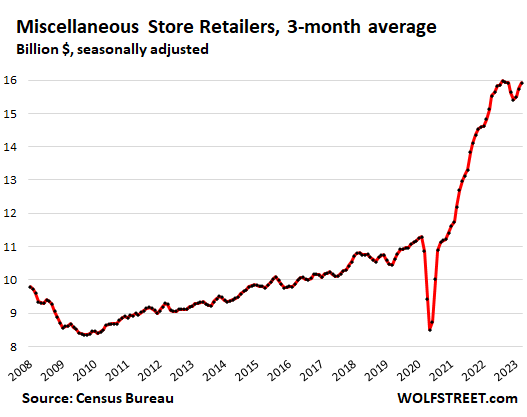
Miscellaneous store retailers, includes cannabis stores (2.3% of total retail): Specialty stores, from art-supply stores to wine-making supply stores. Cannabis stores are the growth driver in this category.
- Sales: $16 billion, seasonally adjusted
- Month over month: +1.1%.
- Year-over-year: +5.2%
- CPI Cannabis doesn’t yet exist. But per Cannabis Benchmarks U.S. Spot Index, average prices have plunged 18% year-over-year.
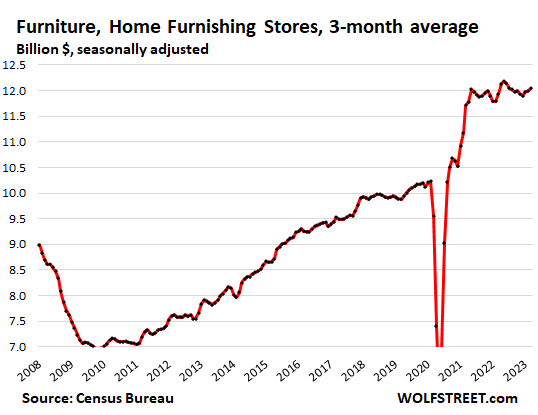
Furniture and home furnishing stores (1.7% of total retail):
- Sales: $12 billion, seasonally adjusted
- From prior month: +0.4%
- Year-over-year: +0.9%
- CPI Household furnishings: +0.8% for the month, +5.8% year-over-year.
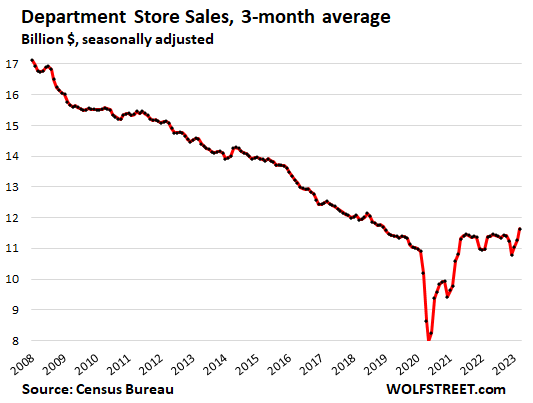
Department stores (now down to 1.7% of total retail, as consumers increasingly bought this stuff online, including at the ecommerce sites of the few surviving department store chains):
- Sales: $11.6 billion
- From prior month: +3.2%
- Year-over-year: +2.4%
- From peak in 2001: -40% despite 21 years of inflation.
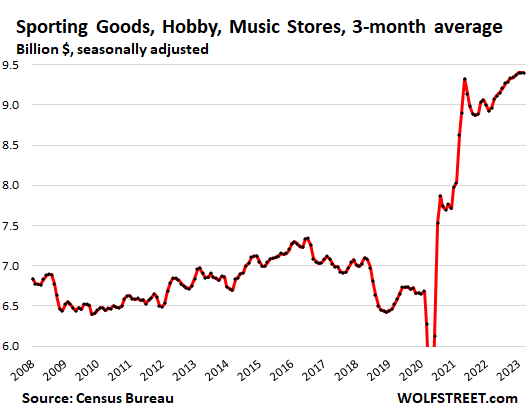
Sporting goods, hobby, book and music stores (1.3% of total retail);
- Sales: $9.4 billion
- Month over month: 0%
- Year-over-year: +4.8%.
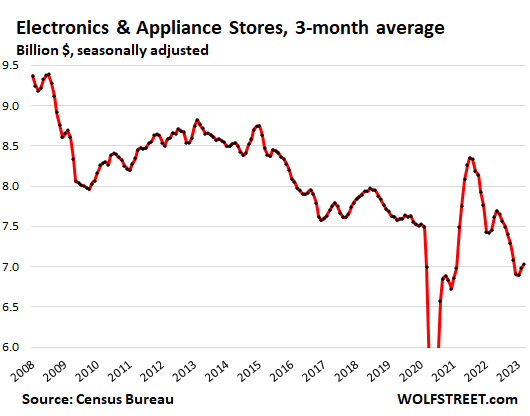
Electronics and appliance stores: Specialty electronics and appliance stores (Best Buy, Apple stores, etc.), not including electronics and appliance sales online and at other retailers.
- Sales: $7.0 billion, seasonally adjusted
- Month over month: +0.7%
- Year over year: -5.7%
- CPI consumer electronics: -0.4% for the month, -11.5% year over year.
- CPI appliances: +0.7% for the month, +1.1% year over year.
Enjoy reading WOLF STREET and want to support it? You can donate. I appreciate it immensely. Click on the beer and iced-tea mug to find out how:

Would you like to be notified via email when WOLF STREET publishes a new article? Sign up here.
![]()
[ad_2]
Source link

Russia Eyes New Rules on State’s Gold, Gem Sales Amid War

Goldman Sachs 2700, Bank of America 3000, and UBS 4000!