S&P 500 Equal Weight Index Dips into Red Year-to-Date. Shows Entire Market Depends on 8 Giants, but They’re Swooning Too
QE giveth, QT taketh away. The two sucker rallies this year of the S&P 500 Equal Weight Index got wiped out.
By Wolf Richter for WOLF STREET.
Stocks in the S&P 500 Equal Weight index [IQX] are not weighted by market capitalization. It contains the same stocks as the S&P 500 index, but each stock weighs the same within the index. The purpose is to see if the performance of a small number of stocks with huge market capitalizations is driving the overall index and is in effect hiding what is happening to the rest of the market.
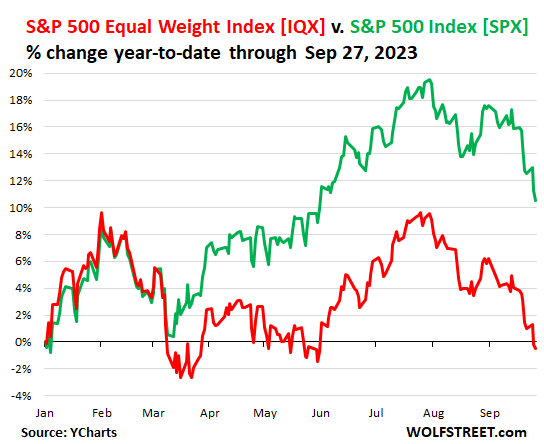
The S&P 500 Equal Weight index today fell into the negative year-to-date (-0.6% YTD at the moment), after having dropped over 9% since July 31. It thereby has totally wiped out the two big sucker rallies this year (red line in the chart below).
- sucker rally in January through February 2 was wiped out by mid-March
- sucker rally from mid-March through July 31 now also wiped out.
But the market-capitalization-weighted S&P 500 index [SPX] is dominated by 8 companies with huge market capitalizations that account for 29% of the index. Those eight stocks have experienced a massive run-up this year through July 31 amid the tech and AI hype-and-hoopla show. That rally has only been partially wiped out. And those companies carry the S&P 500. Since July 31, the S&P 500 index has dropped 7% but is still up 10.5% year-to-date (green line):
The sucker rally starting in mid-March was fueled by the $400 billion in insta-liquidity that the Fed threw at the banking sector over a matter of weeks. The Fed has now drained that $400 billion, plus it has drained another $318 billion with its record QT. Since peak-balance-sheet in April 2022, its assets have dropped by nearly $1 trillion.
The top 8 companies by market capitalization in the S&P 500 index that account for 29% of the index include these standouts:
Nvidia [NVDA] spiked by 244% in seven months from January through July, amid the glorious AI hype-and-hoopla show. Since July 31, Nvidia has dropped 15%. But it’s still up 193% year-to-date. It weighs 2.9% of the S&P 500 index.
Tesla [TSLA] exploded by 171% from January through July 18 and has since then dropped 18% but is still up 119% year-to-date. And it’s still down 43% from its all-time high in November 2021. Tesla weighs 1.9% in the S&P 500 index.
Meta [META] spiked by 162% from January through July 28, and has since then dropped about 10%. It’s still down 24% from its all-time higher in September 2021. Meta weighs 1.9% in the S&P 500.
Apple [AAPL] surged 57% from January through July 31 to a new all-time high of $198.23, and has since then dropped 13%. But it’s still up 36% year-to-date. Apple weighs 7.1% in the S&P 500 index.
Alphabet’s two classes of shares, [GOOGL] and [GOOG], have a weight of 2.13% and 1.82% respectively in the S&P 500 index, giving the company a combined weight of 3.95%. It surged by 55% through September 19, but didn’t get back to its all-time high, and has since then dropped by 6%. Year-to-date, the stock is still up 45%. From its all-time high in November 2021, the stock is down about 13%.
Because Alphabet is listed as two stocks, the 8 companies consist of 9 stocks that make up 29% of the S&P 500 index. The right column shows the year-to-date gain at the moment:
| Top 8 Companies by market cap in the S&P 500 Index | Weight | Gain YTD | ||
| 1 | Apple | AAPL | 7.1% | 36% |
| 2 | Microsoft | MSFT | 6.5% | 30% |
| 3 | Amazon | AMZN | 3.2% | 45% |
| 4 | Nvidia | NVDA | 2.9% | 192% |
| 5 | Alphabet Cl A | GOOGL | 2.1% | 45% |
| 6 | Tesla | TSLA | 1.9% | 119% |
| 7 | Meta Platforms | META | 1.9% | 134% |
| 8 | Berkshire Hathaway Cl B | BRK.B | 1.8% | 15% |
| 9 | Alphabet Cl C | GOOG | 1.8% | 45% |
| Total | 29.1% | |||
The top-heaviness of the S&P 500 makes the overall stock market indices and funds that track them immensely vulnerable to a deflation in just a handful of the tech-bubble stocks.
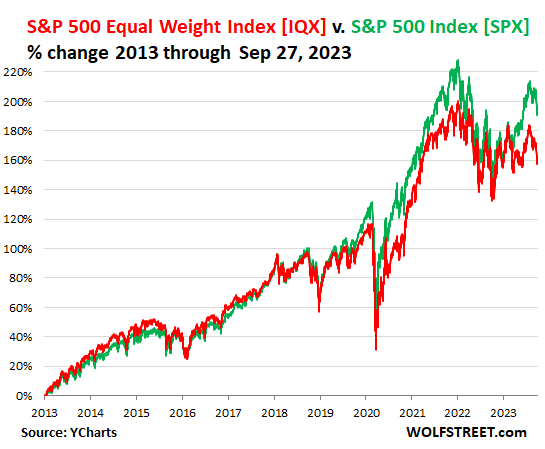
The peeling-away of the S&P 500 index from the S&P 500 Equal Weight index took form in 2018 as the entire world focused their investments on just a handful of US stocks and drove their prices and market caps – and therefore their weight in the index – into the wild blue yonder.
The peak of the indices on January 3, 2022 occurred just after the Fed began tapering QE and after it put the first-rate hike in this cycle on the table for March 2022. QE and interest rate repression fueled this market, and now the record QT approaching $1 trillion and much higher rates for much longer are sapping the markets. QE giveth, QT taketh away.
Enjoy reading WOLF STREET and want to support it? You can donate. I appreciate it immensely. Click on the beer and iced-tea mug to find out how:

Would you like to be notified via email when WOLF STREET publishes a new article? Sign up here.
![]()
[ad_2]
Source link
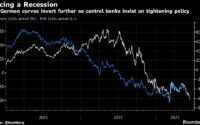
Global Rate-Hike Endgame Is Now Haunted by Recession Worries
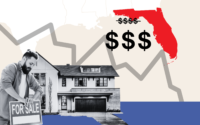
Florida House Prices Fall as Homeowners Desperately Try to Sell