What is Gold Whispering? – Gript
In the second half of this commentary, I will measure Gold against the money supply. This is a little more complex.
Take a look at the chart below. Each green bar below represents the number of barrels of Oil an ounce of Gold can buy. These ratios are based on monthly average prices for both Gold and Oil (Brent Oil).

We can see that in 2008 when Oil rallied sharply to over $130 per barrel, an ounce of Gold could only buy 7 barrels of oil. The collapse of oil prices in 2020 increased Gold’s purchasing power to 92 barrels. We can describe these Gold / Oil exchange rates using percentiles as follows:
Lowest Exchange Rate – 7 Barrel – 0% Percentile
Median Exchange Rate – 17 Barrels – 50th percentile. (50%)
Highest Exchange Rate – 92 Barrels – 100th percentile. (100%)
The last price on the chart is the exchange rate on Dec 1 2023 – 25 Barrels. This rate is the 89th percentile. In other words, the Gold/Oil exchange rate has been lower than 25 barrels 89% of the time since 1990.
It is pretty plain to see that Gold is trading strongly against oil as of today – December 1 2023. This percentile number is really the key data point. It tells us how cheap or expensive Gold is versus Oil.
Now that we have established that Gold is trading at the 89th percentile versus Oil we can repeat the exercise for other commodities. Using the same parameters as in the oil chart above, the chart below cuts to the chase. Each bar below represents the percentile for Gold against various commodities including oil on December 1 2023.

Clearly Gold looks rich against commodities. Furthermore, in terms of the US Dollar, it is within touching distance of its lifetime highs – $2073. But this is not the whole story. We can learn a lot more by comparing Gold to the money(Dollar) supply.
The St. Louis Federal reserve bank gives us a measure of money supply called M3 for the United States. This is a measure of the total amount of cash, current and deposit accounts and some money market instruments in existence. We can use this number as a proxy for the growth in the total amount of dollars in existence over the years. To be clear, I will use the following terms interchangeably: Money Supply = Dollar Supply = M3.
Before we get into the ratio of Gold / Money Supply we should look at how differently both components of the ratio behave. The chart below shows the monthly volatility of the Gold price (yellow) and the monthly volatility in money supply (green). The gold price goes up and down, whereas the Dollar supply almost always grows.

The only discernible retreat in money supply is at the very end of the chart. After the extraordinary boost associated with Covid Hysteria in 2020, we have had a small pullback. The primary lesson from the above chart is that money supply is a ‘growth thing’. Growth is almost constant.
That is all we need to take from the above chart. The next chart is a little more illuminating. It is the ratio or exchange rate. It shows us how many 10-ounce gold bars it would take to match money (Dollar) supply in the United States. I have used the higher metric (10 ounces) for Gold in this analysis. It makes the charting a little easier on the eye. The data is monthly averages. Each green column represents the number (in billions) of 10-ounce bars that it takes to match the money supply.

For clarity, let’s take a look at some percentiles. I am describing these percentiles in terms of Gold’s strength or weakness. For example, when Gold was trading at $260 in 2001 it was at its weakest ‘exchange rate’ to money supply – 1,975Bn bars.
Lowest (weakest) Gold Exchange Rate – 1975 – 0% Percentile
Median Gold Exchange Rate – 1040 – 50th percentile. (50%)
Highest (strongest) Gold Exchange Rate – 574 – 100th percentile. (100%)
Today (Dec1 ’23) it takes 1,001Bn bars to match Dollar supply (M3). 1,001Bn bars is the 57th percentile. This 57th percentile result casts Gold’s present high price ($2,073) in a different light. This ratio suggests that Gold is probably trading close to a mid-range price. Not too hot and not too cold. This is a simple enough conclusion. To reach its 2011 Dollar Supply ratio of 574 it would need to be trading at $3,615 per ounce.
Gold looks like it wants to go higher. It is signaling an end to American geopolitical dominance. The US Dollar is critical to international commerce and US power. The Americans are wrecking the Dollar by using it as a coercion tool against its perceived enemies. Major and minor geopolitical rivals are searching for an alternative to the US Dollar. Ideally, each country wants to replace US fiat currency with their own home grown fiat currency. They have had very little success so far. Mother Nature’s solution to fiat currency is Gold. No political power wants to use Gold as a currency, and yet they are increasingly doing so. That it what the Gold price is telling us.
I have previously written about this here .
I am a long-term gold bull. However, this analysis has made me cautious. Gold is not cheap right now. Nevertheless, Gold is whispering – nation states are buying gold not because they want to, but because they need too.
[ad_2]
Source link
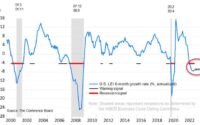
US Leading Economic Indicators Tumble For 10th Straight Month, Signal Recession Imminent

Our Money Is Broken: SchiffGold Friday Gold Wrap Oct. 21, 2022